Dataviz ♥ Web
Exploring Web Graphics APIs for Data Visualization
@miguelrios , Twitter Inc.
Use this slide only when introduced. Thank you!
@miguelrios?
Hello everyone, I'm Miguel Rios. I work at Twitter's data visualization team. We create tools to help the company explore, analyze and visualize our large datasets.
Part of my job is to develop data visualizations using the diverse set of frameworks and standards that the web offers today.
Outline
Brief overview of Web Graphics Standards and APIs.
Real life examples.
Basic guidelines.
In this talk I'll give you a brief overview of these wonderful technologies. Then I'll show you a few real-life examples of our use of them at Twitter and finally, I'll end with some recommendations and guidelines on how to safely use these technologies to your advantage.
Plenty of Options
HTML/CSS
SVG
HTML5 Canvas
WebGL
I figured the best way to start a presentation about web graphic APIs is to actually show some visualizations using them. What you see in the screen is four set of circles with different sizes and colors being drawn using four different technologies.
In the top left, the circles are drawn using HTML and styled using CSS. HTML is the main markup language for creating web pages and other information that can be displayed in a web browser.
In the top right the elements are drawn using SVG, which stands for Scalable Vector Graphics, a vector image format for two-dimensional graphics that has support for interactivity and animation and its supported by all major modern browsers.
In the bottom left, the circles are drawn using canvas. The canvas element is part of HTML5 and allows for dynamic, scriptable rendering of 2D shapes and bitmap images.
Finally, in the bottom right, the elements are drawn using WebGL. WelGL, which stands for Web Graphics Library is a JavaScript API for rendering interactive 2D and 3D graphics within any compatible web browser.
Now, in order to help you understand one of the simplest but most important differences between these technologies, I want you to visualize how the web browser sees these visualizations. To do this, I'm going to use a very awesome extension for Firefox called Tilt to actually visualize my presentation about data visualization.
OPEN TILT
As you may see, there's a big difference in how the circles are being drawn in the web browser. The circles at the top look like actually objects in top of the document, while the ones in the bottom look like an image.
TURN OFF SCREEN.
This is a very important distinction and I want to explain it by diving in with some examples.
I like to use two metaphors to explain these drawing modes. They are not perfect but they helped me understand them better and I certainly hope they will help you too.
TURN ON SCREEN
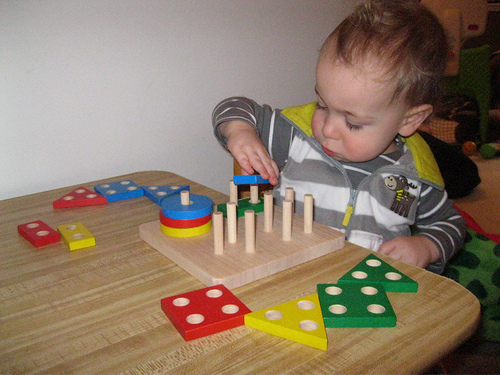
Retained Drawing
(HTML, SVG)
Photo credit: kbeil on Flickr.
I see retained drawing as these shape puzzles kids use to learn colors and shapes. The shapes can be touched, moved around and, well, in theory, you could alter their shape and color. My point is, they are there for you to manipulate directly.
SVG Example
Now I'm going to show you some basic examples so you see how these difference look like in code.
First, this is how you draw a circle using SVG. It's very simple XML code. You open a SVG tag and then insert a circle tag with some attributes. CX and CY take the coordinates of the center of the circle, r takes its radius and in the style attribute you can add CSS rules like a color to fill the circle.
TURN OFF SCREEN.
Now, if you are building interactive data visualizations, it's very unlikely you are going to write SVG code directly. You will probably use either plain Javascript, or one of the many libraries that are open source and help you to programatically perform operations in your objects.
I like to use d3.js, which is a relatively new but well-known JavaScript library for manipulating documents based on data.
TURN ON SCREEN.
SVG Example (using d3.js)
// append svg to parent div.
var svg = d3.select("#example-svgd3").append("svg")
  .attr("width", 300)
  .attr("height", 300);
// append a circle to the svg element.
var circle = svg.append("circle")
  .attr("cx", 150)
  .attr("cy", 150)
  .attr("r", 100)
  .style("fill", "#1f77b4");
Now this is the d3 code used to draw the same circle. It's basically the same thing, but it's in Javascript. The simplest way to show the advantage of using d3 or Javascript is the ability to change properties from the drawn elements programatically.
Please note that when we are drawing the circle, we are storing a reference to it in the variable "circle".
SVG Animation (using d3.js)
// animate the circle radius from 100 to 10 pixels.
circle.transition()
  .attr("r", 10)
  .delay(5000)
  .duration(5000);
Now, let's do a very simple animation. To do this in d3, I simply performed the operation 'transition' in the circle, with the new radius of the circle and a few other optional properties. As you see, the circle is still there but it's smaller now.
TODO: add the circle object with the changing radius.
Canvas Example
// retrieve context from canvas.
var canvas = document.getElementById("dot-example");
var context = canvas.getContext('2d');
// draw circle inside canvas.
context.beginPath();
context.arc(150, 150, 100, 0, 2 * Math.PI, false);
context.fillStyle = "#1f77b4";
context.fill();
Now, I want to show you the same circle, the same animation using canvas. I won't go through the code, but the main difference here is that we are not creating a 'circle' object. Instead, we are performing the operation of drawing in the canvas itself.
Canvas Animation
var r = 100;
var interval = setInterval(function(){
  r = r - 1;
  context.clearRect(0, 0, canvas.width, canvas.height);
  context.beginPath();
  context.arc(150, 150, r, 0, 2 * Math.PI, false);
  context.fillStyle = "#1f77b4";
  context.fill();
  if(r == 10){
    clearInterval(interval);
  }
},50);
In the animation, the main difference here is that we are storing a reference to the circle's radius ourselves and performing the resize operation by redrawing the circle every 50 miliseconds until it's 10 pixels.
Examples
TURN OFF SCREEN.
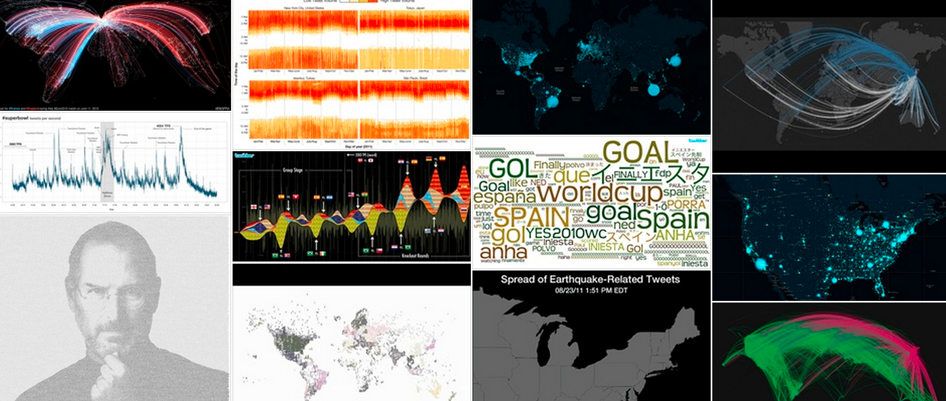
Now I want to show you a few examples of data visualizations we have created at Twitter. These three examples make use of these four web graphic APIs where we believe it was appropiate. I want to use these examples as the base to provide you with a set of guidelines whenever you have to choose between these APIs.
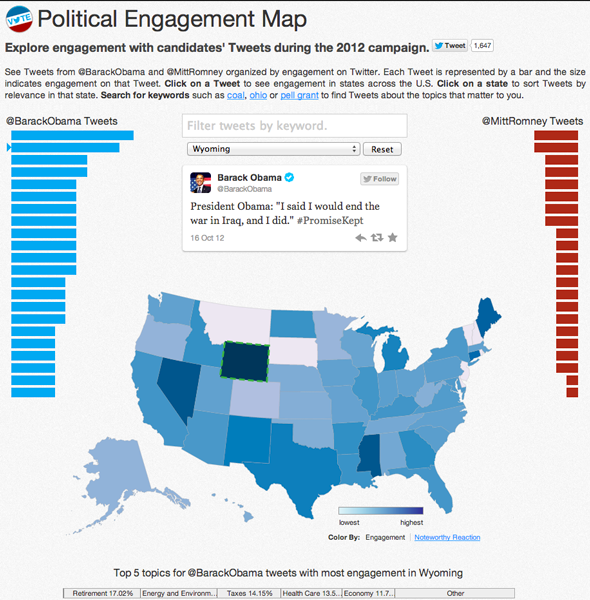
2012 U.S. Elections Map
Engagement of tweets sent by the Presidential Candidates for the 2012 elections.
The first example is an interactive visualization we published last fall, right before the US Elections. We were curious about how U.S. Twitter users engaged with all the tweets the Candidates were publishing. To do this, we grabbed all of their tweets, tagged them with topics, and evaluated how users from different states engaged with them.
The results looked very promising, thus we developed an interactive, exploratory visualization that we published in our Elections portal. You still can access this visualization by visiting http://elections.twitter.com/map.
The main purpose of this visualization was to let journalists and users in general explore it, see how individual tweets were received by different states and see which tweets were received the better by particular states.
The visualization has four main components: two bar charts, left and right, representing the individual tweets, sized by the amount of engamenent (ie. rts and favourites) they reveived. In the center there's a U.S. map with each state colored by the amount of engagement the selected tweet received there, a search box to lookup tweets with different keywords and topics, and a distribution chart showing the topics the users for a particular state engaged the most with.
Most of the components of this visualization are interactive. You can click an individual tweet to see the distribution of engagement by country and topic, and you can also click on a particular state to see which tweets had more engagement in that particular state.
Here are some of the findings users got thanks to the interactivity of this visualiation:
1. When you search for tweets about coal, you can see how users from high-production coal states engaged the most with tweets from Mitt Romney.
2. Users from southeastern states had unusual engagements with tweets about Pell Grants.
3. Users from different states cared the most with different topics:
- Users from Texas cared the most about tweets about Immigration.
- Users from Washington state cared the most about Gay Rights.
- Users from New York cared the most about Abortion rights.
- Users from Nevada cared the most about Taxes.
OPEN TILT
Most of the visualization is actually HTML, including the bar charts that represent the tweets. However, in order to draw the complex shapes of the 50 states, we used SVG, which has very nice support for custom shapes. We used SVG also because it's very simple to attach information to the state shapes,which is very useful when you want to click on a state and actually know which state you click on. SVG was also very helpful here, given that we could set the color of each shape to be encoded with different values by just changing a property in the shape objects.
Also, you can't see it in this view, but we generated static map images for every tweet, so users with browsers with no SVG support would see the visualizations too, even though they couldn't click on the states.
CLOSE TILT
Elections Map
Attribute
Elections Map
Example #2
Example #3
Number of elements:
Low
Complexity of elements:
High
Interactivity?
Yes
Animations?
No
Browser support:
IE7+
Open source resources:
d3.js
Standard
HTML/SVG
Just to recap in this visualization, here's a brief summary of its attributes:
- It has a low number of elements. Only 50 shapes for states and 50 bars for the individual tweets.
- The elements are itself of complex shapes, specifically the states.
- This visualization is very interactive.
- It has no animations.
- We released this to the public, so we wanted to support as many browsers as possible. The visualization works in IE 7 and newer browsers. For browsers with no SVG support we replaced the interactive states map with a static snapshot.
HTML/SVG
Good choice for small number of elements, complex shapes, interactive visualizations.
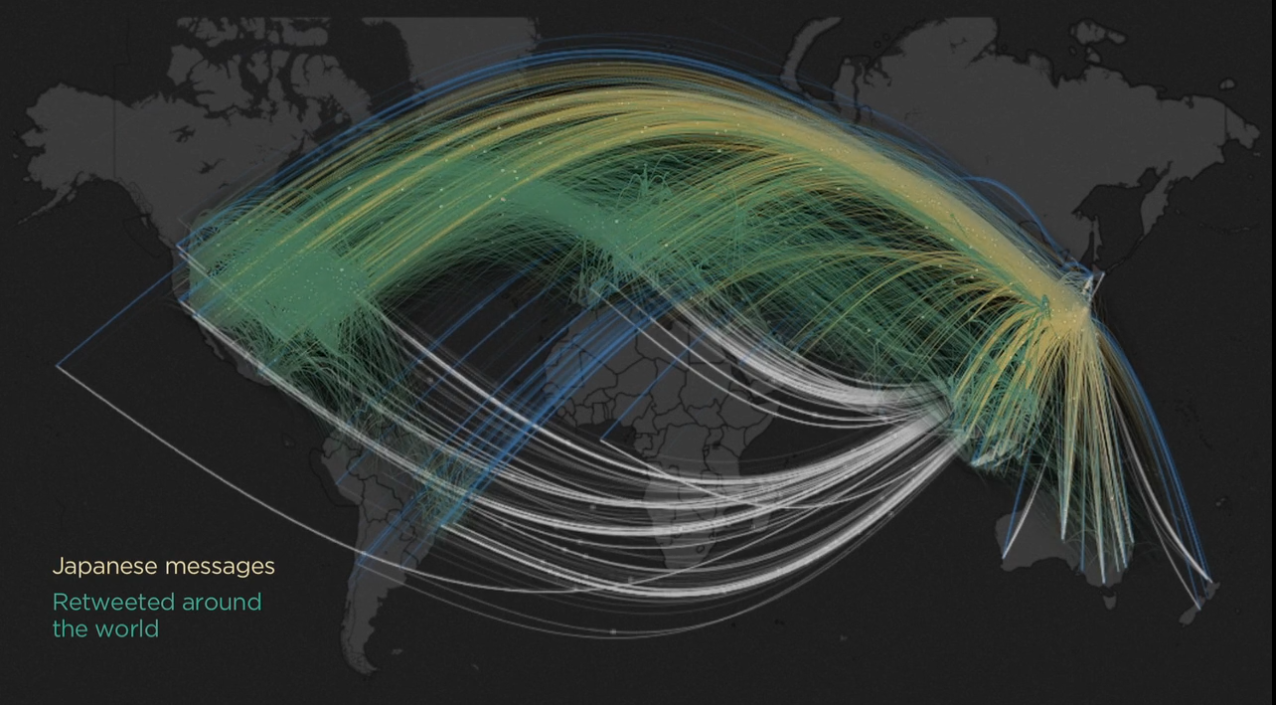
2011 Japan Earthquake
Visualization of tweets directed at, or posted by, users from Japan, retweets and reach of those tweets.
For the second example, I'm going to show you a visualization of tweets traveling through the world we did after the devastating earthquake and tsunami that hit Japan in March, 2011. After the earthquake, we noticed a very high spike in tweets and general use of Twitter from Japan. Later on, reports surfaced of problems with the regular communication channels, and Twitter users there resorted to use Twitter to let friends and relative know they are well as well as to be aware about the latest news and developments about the event.
In the visualization you can see tweets mentioning Japan users sent from all over the world as well as tweets from Japan users mentioning others around the globe. Also, as tweets are mostly public, they get propagated to other users by being retweeted, which you can see in yellow and green.
Now, unlike the first visualization, this one is just an animation used to complement a bigger story we shared in our blog. We released it as a video, and users can't interact with it. In order to explain you which technologies we used to do this visualization and why, I'd like to explain what's happening in the most basic layer.
The path of a tweet
In the basic level, what we are doing in this visualization is just drawing circles on a path. That's mostly it.
Trail: SVG vs. Canvas
We also added a trail behind the tweets, so the user remembers that a tweet traveled between those two points even when the circle already arrived to its destination. To do this, we are basically drawing circles along the path. That's all what's happening in this visualization, 1000s times.
Now, here is an example of drawing four tweets and their trails using this technique, both in SVG at the left, and canvas at the right of the screen.
I'm going to open Tilt again and see the footprint these visualizations are leaving in the browser.
OPEN TILT
As you can see, the SVG one retains references to all the circles we are drawing along the way. This could be handy if we wanted to access these circles later on, maybe to remove them after certain amount of time. in this case we don't need to use them after drawing them. We are just drawing and forgetting about it. This is a perfect case for ccamvas, as we are drawing in an image instead of adding elements inside some document that we are not going to use later on.
Japan Earthquake Viz
Attribute
Elections Map
Japan Earthquake
Example #3
Number of elements:
Low
Large
Complexity of elements:
High
Low
Interactivity?
Yes
No
Animations?
No
Yes
Browser support:
IE7+
Latest
Open source resources:
d3.js
processing.js
Standard
HTML/SVG
HTML 5 Canvas
Canvas
Great for small-to-relatively-large number of elements and animations.
No more to say other than the text in the screen.
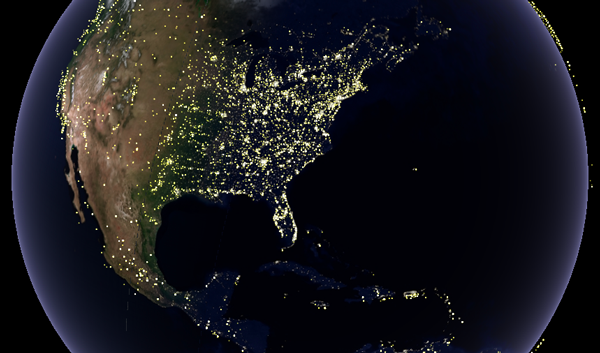
Neil Armstrong's visualization
Retweets from @NASA's tweet about Neil Armstrong passing away.
The third example is a visualization of tweets about Neil Armstrong the day he passed away. As with the second example, we used this visualization as a complement to a story we published in our blog.
We queried all the tweets mentioning Neil Armstrong the day he passed away, and then tried to come with a visualization that could serve as a tribute to him, not just by us at Twitter but from everyone who tweeted about him that day.
The first problem we had when trying to do this visualization is that we found a total of 1.4 million tweets mentioning Neil Armstrong that day. We could aggregate them in some way, but at that stage it was unclear how we wanted to visualize this data.
We tried to use WebGL to visualize this dataset, given that it works very well by using hardware acceleration using both the CPU and the computer's GPU (graphical processing unit).
We decided to use the space methaphor in the visualization. Every tweet was represented as a light, or a candle, in Earth, while we zoom out and the globe spins, until the camera reaches the surface of the Moon.
Even though we used this visualization as a video, the full version is an interactive visualization you can zoom, move around, and even better, you can alter the point og the animation you want to see.
A good view we can get using this feature is Europe's reaction. When the news of Neil Armstrong passing away were published it was late at night in Europe. That's why you can see a few lights/tweets but not that much. As soon as it's dawn, users started to tweet about him as they learned the sad news.
As you can see, this is a 3d visualization with a lot going on. There's a full scene of space with the Earth, night/day time, the orbiting Moon and more than a million tweets being rendered in the screen. WebGL was the only way to go in this case.
Neil Armstrong Visualization
Attribute
Elections Map
Japan Earthquake
Neil Armstrong
Number of elements
Low
Large
Large
Complexity of elements
High
Low
High
Interactivity?
No
Yes
Yes
Animations?
No
Yes
Yes
Browser support
IE7+
Latest
Latest
Open source resources
d3.js
processing.js
PhiloGL
Standard
HTML/SVG
HTML 5 Canvas
WebGL
Just talk about the table.
WebGL
Great for small-to-very-large number of elements, complex shapes, animations, 3d visualizations.
Before diving in, ask yourself:
How many elements in the visualization?
How complex are these elements shaped/arranged?
Is it going to be interactive?
Will it have animations or transformations?
Do you need to support older web browsers?
Are there related open source examples or frameworks? Spoiler: yes.
As you noticed, I used the same set of attributes for all visualizations. Whenever there's some new data we want to visualize, these are the first questions we have asked ourselves to start thinking about which technologies and libraries we should use or avoid.
Just repeat what you see in screen.
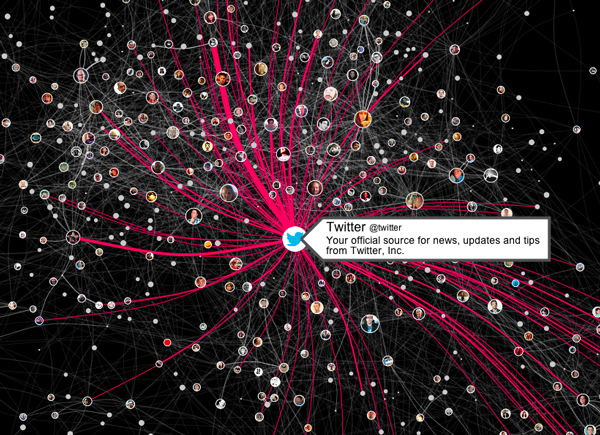
Graph of Twitter Employees
Conversations between Twitter employees.@moebio )
Now I want to show you real quick a last example. This one doesn't come from Twitter, but it's about Twitter. It's an awesome, although a bit creepy graph of conversations by Twitter employees, done by Santiago Ortiz, who is actually going to speak here later.
It's a highly interactive visualization. Employees are nodes in the graph, conversations between then are mapped using lines between the nodes. You can hover in the nodes and see information about them and you can click in a node to see the graph from a different perspective. So this is an interactive visualization, with animations, information attached in every node and edge, and it works very smoothly, even though it must have tens of thousands of elements between the nodes and connections.
V1: Now, quick question to all of you: using what I showed you before about these graphic technologies, how many of you think this is a visualization done using canvas?
WAIT
How many of you think this is a visualization done in SVG?
WAIT
Well... It's actually a visualization done in canvas. All the interactivity, the information attached to the elements in the visualization is there, presumably developed by Santiago as a layer of abstraction in top of the canvas visualization.
And that brings me to the last poing of this talk. If you take only one thing out of these last 40 minutes, let it be this:
Don't let frameworks and APIs limit your visualizations.
Be creative.
I think that when you are starting to learn about data visualization and the web, you should use these guidelines I explained before. You should also try to learn how libraries and frameworks you are using work under the hood.
That said, there will be one point in which you'll probably feel comfortable enough to start breaking the rules and take these technologies to their edges. At that point, you shouldn't stop and be bounded by this "limitations". Web browseres and these graphics APIs are getting ridiculously good, and the open source community has done an amazing job in building frameworks and libraries that will help you to take your visualizations to the next level.
So my final point is this: no matter what, don't let a framework, library or technology, limit your visualizations. Above everything else, just be creative.